Latest from the TS-CHEM Blog
Check out the latest TS-CHEM Blog posts below, or click the button below to visit the TS-CHEM Blog to explore previous posts!
TS-CHEM BlogPosted July 17, 2024
New Plume Center of Mass Analysis Tool
Groundwater contaminant plume remedy plans that are considering Monitored Natural Attenuation (MNA) are often required to demonstrate a stable plume. One method to graphically depict plume stability involves determining the center of mass of the plume over some period of time. Building on the previously identified usefulness of software tools for demonstrating plume center-of-mass stability, the latest version of TS-CHEM (version 2024-3) includes a new Analysis Tool that is capable of calculating the center of mass for any plume, or set of commingled plumes, generated by the software.
Posted July 8, 2024
Simplify Source Model Setup with the New CSV Import Feature
One exciting addition in the latest release of TS-CHEM (version 2024-3) is the new “CSV Import" feature for time-varying source concentrations. Several of the TS-CHEM solutions allow the user to specify source concentrations that change with time (ATRANS3 and ATRANS4; AT123D-AT FT and AT123D-FT). The CSV Import feature can be used to efficiently set up and solve a time-varying source model by allowing users to import time-and-concentration source histories that have been created manually by the user, or exported from other user software, in CSV format.
Posted May 24, 2024
New Modeling Tools - SCL Plume Model and PVM Calculator
The TS-CHEM team is pleased to announce the release of two new Microsoft Excel-based spreadsheet utilities – the SCL Plume Model, and the Plume Volume and Mass (PVM) Calculator. With straightforward inputs and intuitive numeric and graphic outputs, these tools allow environmental practitioners to quickly estimate the extent of plumes at specified points in time, and get a sense of key plume characteristics, including the volume of impacted groundwater within the contaminant plume, the mass contained within the plume, and/or the mass flux across a user-specified plume transect.
Posted October 13, 2023
Estimation of TS-CHEM Source Terms Using the Newly Released Soil Infiltration and Leaching Tool (SILT)
The “Soil Infiltration and Leaching Tool” (SILT), a Microsoft Excel-based spreadsheet utility that allows users to simulate one-dimensional contaminant fate and transport processes through the vadose zone in a simple, user-friendly environment. The SILT utility is a perfect companion to TS-CHEM, allowing site investigators to evaluate potential impacts to groundwater associated with contaminated soil, and estimate contaminant source terms that can then be incorporated into TS-CHEM and used to estimate the extent and duration of resulting contaminant plumes.
Learn more about SILT, and how it can be used to generate TS-CHEM source terms.
Posted August 17th, 2023
TS-CHEM Example Applications – Commingled Plume Analysis
The presence of commingled plume conditions at sites can be challenging for environmental professionals responsible for investigating and remediating impacted groundwater, making it difficult to determine the extent to which sources may contributing to the commingled plume, and in turn, who may be responsible for cleaning them up. In this Example Applications series Blog Post, we demonstrate how TS-CHEM can be used to perform quick and easy analyses that allow site investigators to not only quantify the impacts of the commingled plume (e.g., impacts to downgradient receptors) but also evaluate the individual contributions from each source.
Learn more about using TS-CHEM to analyze a comingled plume.
Posted July 26th, 2023
TS-CHEM Solution Library - AT123D-AT
The TS-CHEM program provides an easy-to-use software environment in which to analyze contaminant plume transport, and includes a comprehensive library of more than 30 different analytical solutions to the advection-dispersion equation. For this post in the Solution Library series, we will be focusing on the AT123D-AT family of models published by Dan Burrnell in 2012 which represents an updated version of the original AT123D model suite developed by G.T. Yeh.
Learn more about the AT123D-AT family of models, and how they can help evaluate groundwater plume transport scenarios.
Posted June 15th, 2023
TS-CHEM Example Applications – Natural Source Flushing with MNA
Monitored Natural Attenuation (MNA) is a popular remedial choice but requires data-driven lines of evidence to demonstrate that a site is a suitable candidate for MNA. In the second post in the TS-CHEM Example Application series, we look at a case where a gasoline spill has resulted in a benzene plume that threatens a nearby residential area. The source is cleaned up, but the responsible party would prefer to implement MNA for the resulting benzene plume. Luckily, TS-CHEM is the perfect tool to evaluate the growth and decay of a contaminant plume from a slowly flushing gasoline source in order to evaluate the potential impacts to receptors downgradient from the source area.
Posted May 12th, 2023
TS-CHEM Version 2023-1 Now Available!
A new version of TS-CHEM has been released! Updates include:
- New color spectrum control for contour charts
- Refined model setup parameter units conversion factors
- Enforced QA check on model data save and reload process
- Added plume boundary specification for log contour plots
- Minor bug fixes
Learn more about how you can utilize the new features of TS-CHEM v2023-1 to customize your contour plots into customized report- or presentation-ready graphics for your plume transport modeling analyses.
Posted April 14th, 2023
State and Federal Guidance Spotlight - Use of TS-CHEM for Estimation of NJDEP Classification Exception Areas
There are a number of state and federal regulatory documents that prescribe the use of solute transport models to support site investigation and remediation activities, along with guidelines on the types of analyses that need to be performed, models that should be utilized, and in some instances, specific input parameters that must be incorporated into analyses. In this first post in the “State and Federal Guidance Spotlight” series, we take a look at the New Jersey Department of Environmental Protection’s (NJDEP’s) Classification Exception Area Guidance, and how TS-CHEM can be used to estimate plume extent and duration to support the delineation of Classification Exception Areas for sites where impacts to groundwater may be present.
Posted March 24th, 2023
TS-CHEM Example Application - Receptor Impact Assessment
TS-CHEM is not only simple and easy to use, but it can be applied to a number of different common situations when it comes to impacted groundwater, making it the perfect tool for environmental professionals who perform groundwater investigation and remediation activities. In this blog post, we introduce the first Example Application in the series, which demonstrates how TS-CHEM can be used to model the length of a contaminant plume (in this case a benzene plume) in order to determine if it will impact domestic wells at a nearby residential development.
Learn more about using TS-CHEM to model maximum plume extent.
Posted March 2nd, 2023
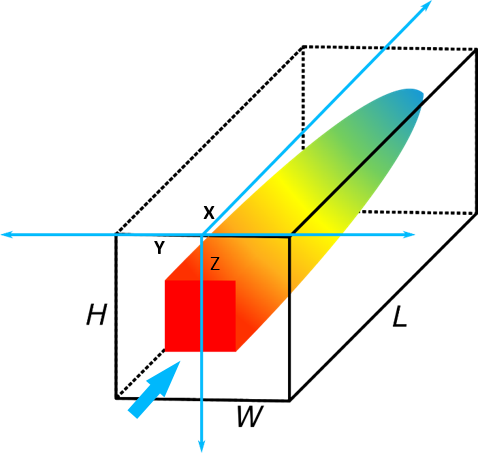
1-D vs 3-D Transport Analysis of Contaminant Plume Extent
Contaminant plume analyses based on 1-D models are likely to overestimate plume extent. This may result in an overly-conservative assessment of impacts that are not likely to occur. More accurate evaluations of plume extent can be calculated using 3-D contaminant transport models. TS-CHEM provides a library of over 30 analytical 3D plume transport solutions for making these types of evaluations.
Learn more about 1-D and 3-D plume transport models, and how they compare in evaluating plume extent.
Posted February 23rd, 2023
TS-CHEM Solution Library - ATRANS
The TS-CHEM program includes a comprehensive library of more than 30 different analytical solutions, each with different capabilities, including how they represent contaminant sources. For this first post in the Solution Library series, we will be focusing on the ATRANS family of models developed by Chris Neville at SS Papadopulos & Associates. In fact, the ATRANS1 model is included in the DEMO version of TS-CHEM!
Learn more about the ATRANS family of models, and how they can help evaluate groundwater plume transport scenarios.
Posted February 9th, 2023
New Features in TS-CHEM v2022-3
TS-CHEM v2022-3 has some great new features, including new options for BIOSCREEN-AT, Dark Mode (Mac version) and the ability to double-click project files to open them. But some of the most powerful features center around the new chart controls.
Posted December 9th, 2022
TS-CHEM - The Swiss-Army Knife of Solute Transport Modeling
Environmental professionals are often tasked with investigating contaminated sites to understand the nature and extent of contamination in groundwater, and select an appropriate remedy that will effectively limit migration of impacted groundwater, treat it, and prevent groundwater plumes from reaching sensitive receptors. To do this, a sound conceptual site model (CSM) is necessary, which requires not only collection of adequate site data (including groundwater sampling data, water level elevation data, and information on site hydrogeologic conditions) and application of professional judgement, but also the use of data analysis tools and techniques that allow for a better understanding of the fate and transport of contaminants in groundwater.
Learn more about how TS-CHEM can assist with developing a sound CSM.
Posted August 17th, 2022
Visualize Your Modeled Plume with the New Map Overlay Feature
One of the most exciting recent additions to TS-CHEM is the new “Map Overlay” feature. After a concentration contour chart has been created and displayed, the TS-CHEM Map Overlay tool can be used to visualize the calculated plume. The plume is displayed as an overlay on a digital map, with the source located at the user-entered address. Attributes of the map and the plume can be modified using various Map Overlay controls.
TS-CHEM BLOG